Statistics
Camlytics Single aggregates analytics events data for each camera and builds various statistics based on that data.
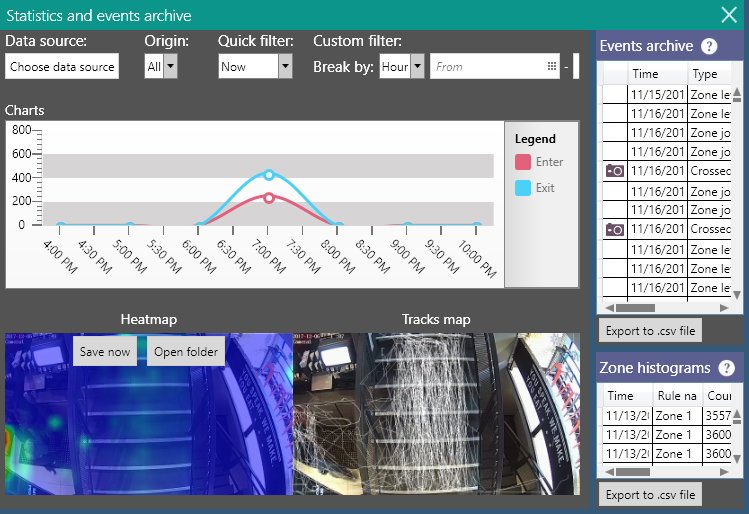
Charts
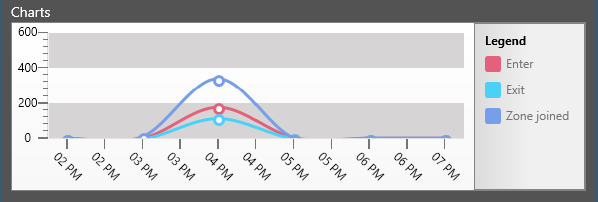
Charts show visual representation of events on different time spans. They are also convenient for comparing frequency of different event types. Basic chart shows distribution of frequency of different event types in defined time range.
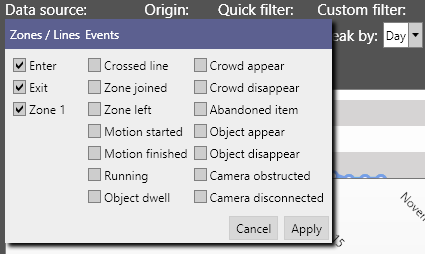
To build a chart, choose data sources from Data source menu - it can be either Zones/Lines or single event types.
In case of Zones/Lines as data source, all events that are generated by that item will participate.
To move through different predefined timespans choose option from Quick filter dropdown menu.

If you are interested in particular date range, you can define it in Custom filter. You can also choose appropriate breakdown time - by hour, by day, by week or by month - depending on your dates range.

If you want to remove the selected events and data associated with them (heatmap, zone histograms), click the Delete button. This comes in handy if you analyze the video file and want to re-run the analytics without adding old events / heatmaps to it. Please notice that the data is removed permanently.
Heatmap
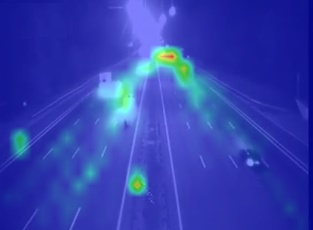
Heatmaps show "hot" and "cold" areas on the video scene, which indicate spots where most objects are concentrated for longest time, i.e. areas with high and low activity.
Heatmaps can be very useful for analyzing concentration of different objects - people, cars, etc.
Usually heatmap data is collected hourly, but this value can be changed in Analytics settings. The bigger the data collection time - the less space database file will take on disk, but minimal breakdown time will also be bigger.
Heatmap is built the same way as charts, except it doesn't need any data sources chosen.
Heatmap aggregation cycle is based on the Reset setting for the realtime video sources and is fixed for the Video file and Video folder sources (one aggregation cycle per one video playback).
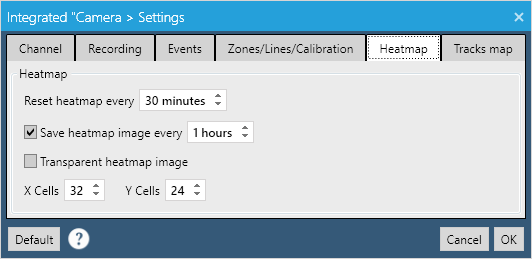
Reset heatmap setting regulates how much time object trajectories data is aggregated before it is saved to database. Basically, it is the discretization value for the heatmap data. Should not be very low to avoid high disk usage (the smaller the value the more entries in the database).
Save heatmap image allows saving *.png heatmap into the %appdata%\Camlytics\Data\{channel-guid}\Heatmaps directory.
Transparent heatmap image regulates whether the destination image will have a background from the channel or it will be a transparent *.png.
X Cells, Y Cells changes heatmap resolution - the more cells the higher resolution. Not recommended to set value more than 100 to avoid high disk usage.
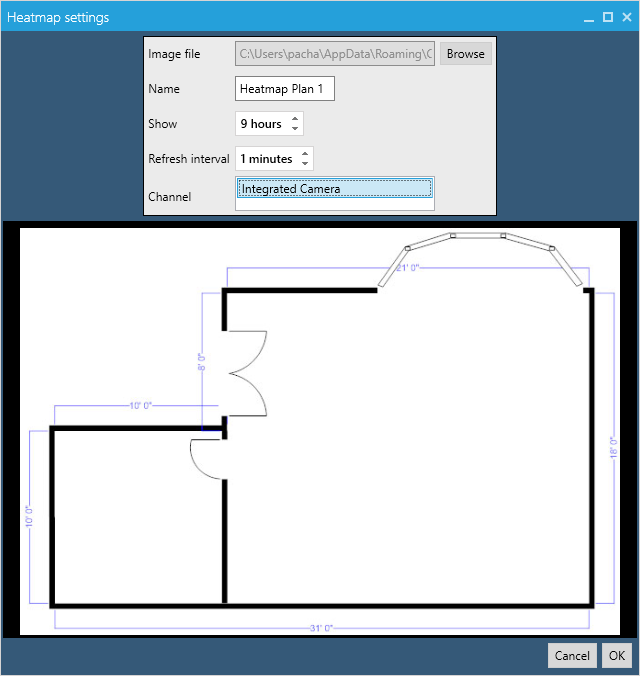
You can also add a heatmap plan with channel floor plan background and the corresponding heatmap overlayed over it. The heatmap plan will update at any given interval.
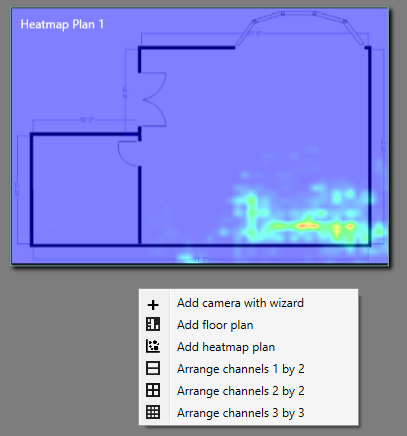
Image file is a custom heatmap background.
Name is a title of the plan.
Show sets how many hours of object statistics accumulate on the heatmap.
Refresh interval sets how often the heatmap will be updated on the user interface.
Channel is a channel which will correspond to the heatmap's data.
Tracks map
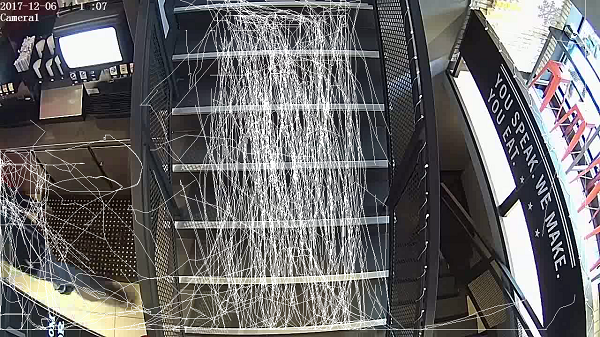
Tracks map aggregates all trajectories from all detected objects in the channel scene.
Tracks maps can be useful for analyzing directional flows of different objects - people, cars, etc.
By default tracks map image is not saved to disk periodically but you can change that in the channel settings.
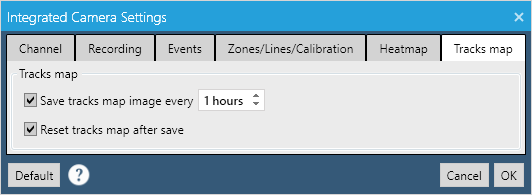
Save tracks map image allows saving *.png tracks map into the %appdata%\Camlytics\Data\{channel-guid}\Trackmaps directory.
Reset tracks map after save resets background image and removes all tracks from it.
Events archive
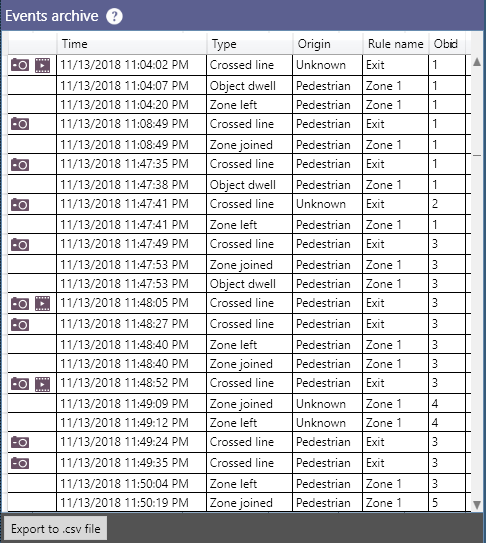
Camlytics Single stores all events in database, so you can access them any time. To get specific type of events that happened in the defined time span, you need to choose data source and define dates and breakdown values in custom filter.
If screenshots setting is enabled for particular event type, you will see the camera icon, which opens the corresponding event snapshot.
To export selected events to .csv file, click the Export to .csv button.
If you want to receive camera events in realtime and perform custom actions on them, use our API
Zone histograms
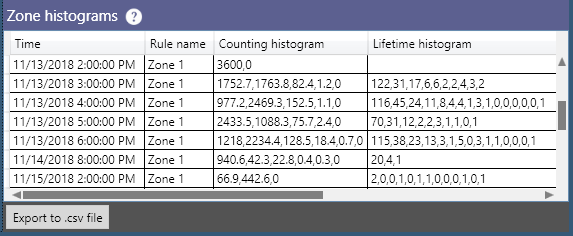
If your calibration includes zones, then you might be interested in getting the objects lifetime and objects counts distributions in those zones.
Counting histogram helps identify how much time each zone had that many objects inside. For example, the second table row (from the top) in the image shows that on 11/13/18 from 2 PM to 3 PM there were 0 objects during 1752.7 sec, 1 object during 1763.8 sec, 2 objects during 82.4 sec, 3 objects during 1.2 sec.
As a usecase, it can help to calculate how many people were in line on average every hour or during the whole day.
Lifetime histogram helps identify how many objects inside stayed that long in each zone. The histogram step is 10 sec. For example, the second table row (from the top) in the image shows that on 11/13/18 from 2 PM to 3 PM 122 objects lived under 10 sec, 31 object lived under 20 sec, 17 objects lived under 30 sec, 6 objects lived under 40 sec, 6 objects lived under 50 sec and so on.
As a usecase, it can help to calculate how much time people waited in line on average every hour or during the whole day.